Rift
Event Location
Map
 |
Between June 17 and June 20, 2007, the East Rift of
Kilauea Volcano opened approximately 2 meters. See USGS site
for details. Crustal deformation of the rifting event was
monitored in real time using GPS stations.
Here we report on two interferograms - ascending and descending - that
were collected by the L-band
synthetic aperture radar
aboard the ALOS spacecraft that is operated by the Japanese Space
Agency - JAXA. We find that the L-band interferograms
retain
coherence better than interferograms made from C-band
instruments. The interferometric phase is completely unwrapped
with a single seed point. In addition, azimuthal offsets can be
derived from the reference and repeat images. The three
components provide the full
3-component vector displacement for this event. These data will
be
used, together with precise GPS measurements, to constrain
the models of dike opening and caldera deflation associated with this
event.
|
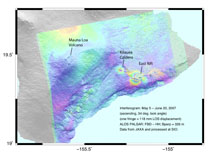
Ascending Interferogram
Radar interferogram constructed from ALOS PALSAR acquisitions
on May 5 and June 20. This time period spans
most of the "Father's Day" (June 17) rift event. These data were
acquired in the fine beam dual polarization mode (FBD-HH, 14
MHz). Correlation is high even in forested areas and the phase
has been unwrapped and scaled to line-of-sight millimeters (LOS).
The radar look direction is from the WSW and 34 degrees from
vertical. GPS receivers with continuous vector measurements are
marked by red triangles.
|
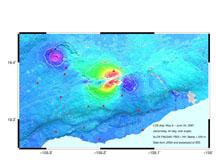 |
Zoom of Interferogram
 |
This radar interferogram is zoomed from the previous
image. Rift-flank uplifts are largely symmetrical while there is
pronounced asymmetry in the rift opening component. The Makaopuhi
crater shows more than 40 mm of local inflation. GPS receivers
with continuous vector measurements are marked by red triangles.
|
Descending Interferogram
Radar interferogram constructed from ALOS PALSAR acquisitions
on Feb 28 and July 16 (8:52 GMT). This time period spans the “Fathers
Day” (June 17) rift event. These data were acquired two modes. The Feb
28 acquisition was FBD-HH (14 MHz) while the July 16 acquisition was
FBS (28 MHz) the raw FDB data were interpolated to the higher FBS
sampling rate. The radar look direction is from the ESE and 34˚ from
vertical.GPS receivers with continuous vector measurements are
marked by red triangles.
|
 |
Comparison with GPS LOS Displacements
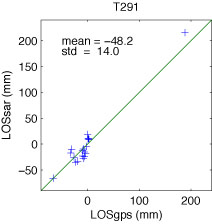 |
Comparisons of 3 components of deformation from two
interferograms with deformation vectors from 19 continuous GPS sites
show rms line-of-site precision of 14 mm and an rms azimuth precision
(flight direction) of 71 mm.
|
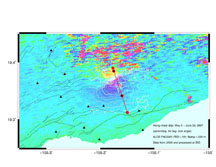
Azimuth Offsets Compared with GPS
Crustal displacement in the flight direction from ALOS PALSAR
acquisitions on May 5 and June 20. Displacements are derived from
cross correlation of image patches and are scaled to mm. This
component of displacement is perpendicular to the LOS displacement and
also about 10 times less accurate. GPS receivers with continuous
vector measurements are marked by black triangles. A displacement
profile extracted along the line A-A' (shown in the PDF but not the
thumbnail at right) shows excellent agreement with the baseline change
between GPS sites NUPM and KTPM.
|
 |
Small Cracks Observed in Phase Gradient Confirmed by Field Observations
- Blind Test
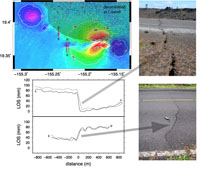 |
Areas of high phase gradient appear as cracks along the Chain
of Craters Road. The large crack was discovered and repared after
the Father's Day Event. The location of the smaller cract was
predicted from the ALOS phase gradient, coordinates were sent to Matt
Patrick (mpatrick@usgs.gov) at the HVO and he examined the road for
cracks. Here is his assessment: "Anyway, I did find three
cracks in the road in the general area. One crack is exactly
where your line of points crosses the road. I have attached a few
photos. The crack consists of three, left stepping segments
which cross the entire road. South of this crack about 150 m is
another crack (crack 1 in map), however it does not cross the entire
road (I didn't take a photo of it). Thirty meters north of crack
2 is crack 3, which spans the road and is wider, maybe approaching a
centimeter."
|