From the
Steinbrugge Collection, Earthquake Engineering Research Center,
University of California, Berkeley.
Image by Karl V. Steinbrugge.
In Lecture 11, I discussed some fundamental concepts in seismology as well as a bit about some global seismology. Here's a brief list of some of the things we talked about:
In Lecture 11, we talked about how people use earthquakes as a tool for exploring the global structure of the Earth. Many of my colleagues and friends at SIO study just the aspect of seismology.
There is, of course, another broad class of seismology which deals with more local-scale issues. This is the area of seismology that I work mostly in, local and regional seismology. Local and regional seismology, very roughly, are concerned with processes that happen regions which range from less than a few meters to something like 500 km. You might call it "earthquakes for earthquakes' sakes".
I think local and regional seismology can be broadly divided into a few general concentrations:
The most important primary effects of earthquakes are
Fires are probably the single most important secondary effect of earthquakes.
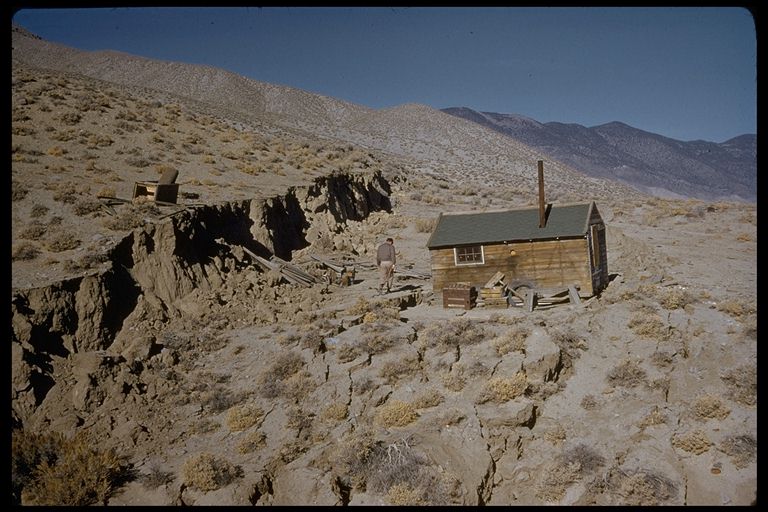
Ground rupture is an important effect of earthquakes which occurs when the earthquake movement along a fault actually breaks the Earth's surface. While active ground rupture is comparatively rare, there have been cases of it in California -- for example, during the 1906 earthquake, fences near Pt. Reyes were offset by as much as 7 meters. And in the Owens Valley earthquake in 1872, a fault scarp as much as 8 meters high broke the ground near Lone Pine. Rupture causes problems for humans by, well, rupturing things; pipelines, tunnels, aqueducts, railway lines, roads, and airport runways which cross an area of active rupture can easily be destroyed or severely damaged.
Below is a classic picture of a scarp formed by the 16 December 1954 Dixie Valley earthquake (magnitude 6.8) in Nevada. The shack next to the scarp was relatively undamaged, despite being only a few meters from the two- to three-meter offset.
From the
Steinbrugge Collection, Earthquake Engineering Research Center,
University of California, Berkeley.
Image by Karl V. Steinbrugge.
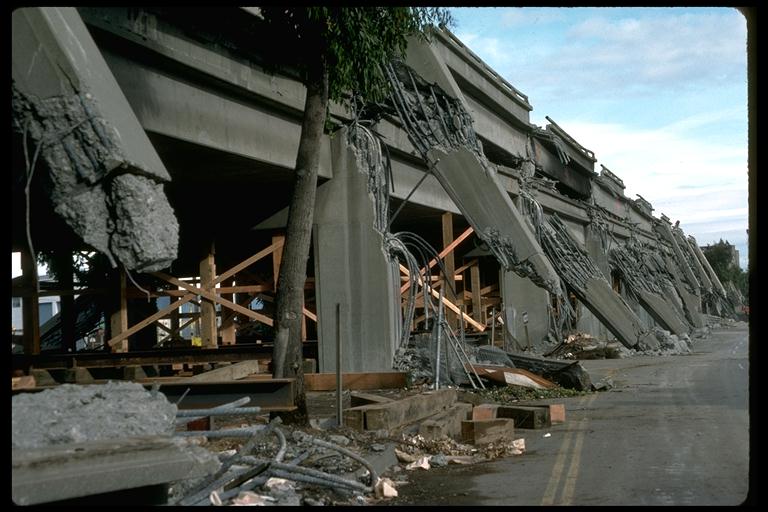
Below is an image of the Cypress viaduct which was part of Interstate 880 in Oakland, CA. The upper level of the two-level structure has collapsed onto the lower level as a result of failure of the support columns. The columns failed partially in response to ground shaking from the 17 October 1989 Loma Prieta earthquake amplified by loose sediments near the Oakland waterfront. 41 people were killed in the collapse.
Originally image 022sr.jpeg, by H.G. Wilshire, U.S. Geological Survey.
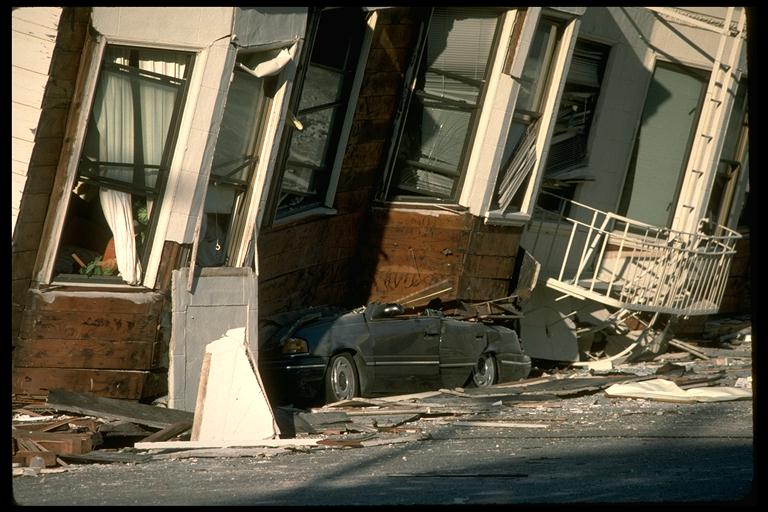
Below is an image from the Marina District in San Francisco. The Marina District is built on Bay mud which was pumped onto the San Francisco waterfront for the 1915 Pan-American Exposition. This fill both underwent liquefaction (see below) and considerably amplified ground shaking from the Loma Prieta earthquake. These factors together led to the collapse of many houses and apartment buildings in the Marina District.
Originally image 009sr.jpeg, by J.K. Nakata, U.S. Geological Survey.
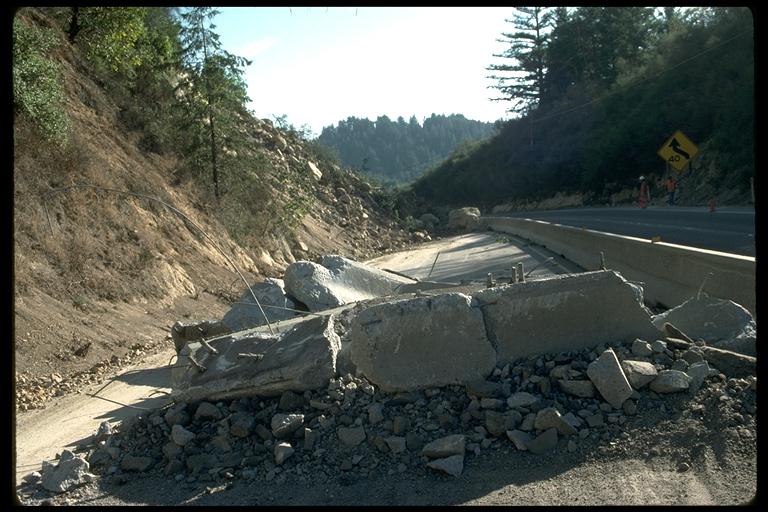
Landslides are caused by earthquakes both by direct rupture and by sustained shaking of unstable slopes. They can easily destroy buildings in their path, or block roads and railroad lines, or take hilltop homes with them as they tumble. They even can dam rivers on occasion, like in the 17 August 1959 Hebgen Lake earthquake (magnitude 7.1) in Montana.
Below is an image of a large landslide which fell across Highway 17 in the Santa Cruz Mountains after the Loma Prieta earthquake. The concrete blocks in the foreground are broken chunks of the center divider on the highway. The road, which is a major commute route from Santa Cruz to the Silicon Valley, was closed for several weeks after the earthquake.
Originally image 068sr.jpeg, by C.E. Meyer, U.S. Geological Survey
Tsunamis, which are popularly -- and incorrectly -- known as ``tidal waves,'' are a grave hazard to many parts of the world, particularly around the Pacific Ocean basin. Tsunamis are a series of water waves caused when the seafloor moves vertically in an earthquake (which is why they are uncommon in California earthquakes -- most CA earthquakes are strike-slip, with little or no vertical motion) and which can travel vast distances in a short period of time. Tsunami speeds in the deep ocean have been measured at more than 700 km/hr, comparable to some jet planes, and when tsunamis reach shallow water near the coast, they can reach heights of more than 27 meters (90 feet)! Remember that tsunamis are a series of waves, and may start with a gentle withdrawal of water, followed by a very abrupt arriving wave, followed by another withdrawal, etc. The safest thing to do if you hear a tsunami is coming is to move to higher ground away from the beach as quickly as possible.
Below is an image of a tsunami striking the coast in Hilo, Hawaii. This tsunami was generated by a magnitude 7.8 earthquake in the Aleutian Islands on 1 April 1946. Here, the tsunami height is about 6 meters (20 feet).
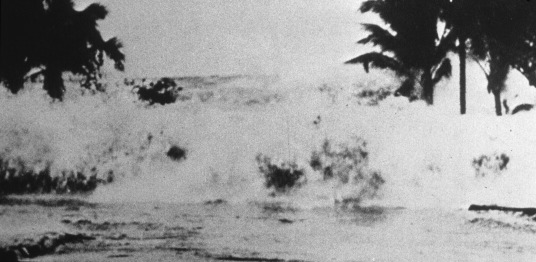
Image by Mrs. Harry A Simms, Sr.
Below is one of the most famous tsunami pictures in existence, also of the 1946 tsunami in Hilo. The picture was taken from the deck of the SS Brigham Victory in Hilo Harbor. The man in the picture (indicated by the white arrow) was killed by the wave.
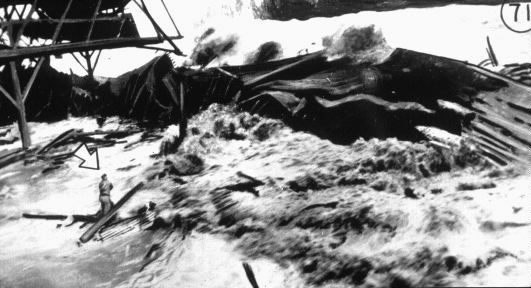
Image by NOAA/EDIS
Liquefaction and subsidence of the ground are important effects which often are the cause of much destruction in earthquakes, particularly in unconsolidated ground. Liquefaction is when sediment grains are literally made to float in groundwater, which causes the soil to lose all its solidity. Subsidence can then follow as the soil re-compacts. Sand blows, or sand volcanoes, form when pressurized jets of groundwater break through the surface. They can spray mud and sand over an area a few meters across. All of these effects pose a grave danger to buildings, roads, train lines, airport runways, gas lines, etc. Buildings have actually tipped over and sunk partway into liquefied soils, as in the 1964 Niigata earthquake in Japan. Underground gas tanks and septic tanks (yuck!) have been known to float to the surface through liquefied soils. All told, liquefaction and associated effects resulted in more than $20 billion damage in the 1995 Kobe earthquake, and similar levels of damage are possible in US port facilities during a large earthquake.
Below is a picture of the Kwangishicho Apartments in Niigata, Japan. Three of the buildings (the white ones) have tilted over due to liquefaction. One of the buildings has tilted 75° from the vertical. Despite these large tilts, the apartments were largely intact -- people were able to escape by walking down the side of the most tilted building.

Image from CDMG.
Below is a good example of a series of sand blows. The total length of the deposit is about 6-7 meters (20-23 feet), and it resembles a system of volcanic fissures and vents in miniature. This is a good example of why sand blows are also called ``sand volcanoes''.
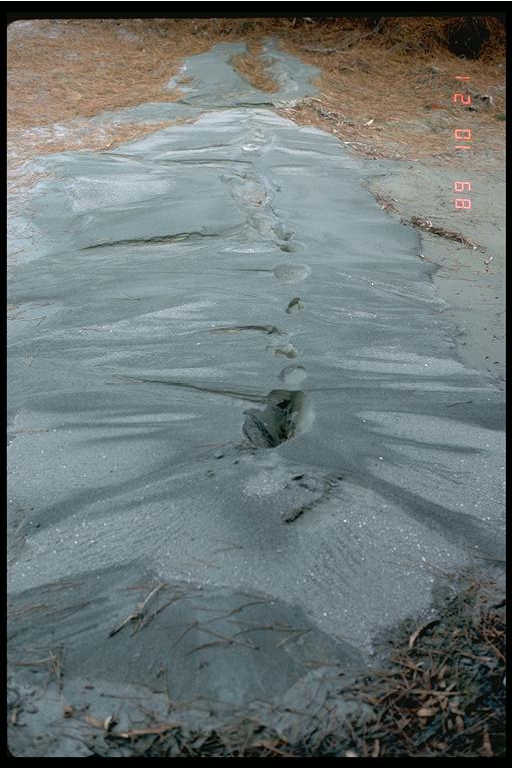
Originally image 086sr.jpeg, by J.C. Tinsley, U.S. Geological Survey.
Fires are a major source of damage after earthquakes. Ground rupture and liquefaction can easily rupture natural gas mains and water mains, both contributing to the ignition of fires and hindering the efforts to control them. In an amazing example of this, during the 1994 Northridge earthquake there were actually places where water was pouring down streets from broken water mains -- and at the same spot and same time, fire was roaring out of ruptured gas mains! Shaking also contributes to starting fires, by knocking down power lines, spilling flammable liquids from storage containers, and tossing hot coals from barbecues and stoves. In the 1923 Kanto earthquake in Japan nearly 100,000 people died -- over 70,000 of them due to fires which swept the area after the earthquake. And of course most of the damage in San Francisco from the 1906 earthquake was caused by the subsequent fires.
First off, let's make sure we get terms right. An earthquake forecast is not an earthquake prediction. An earthquake forecast is a long-term (years to decades) statement of the probabilities for a large earthquake on a given fault or in a given region. Such forecasts are now made by responsible scientific and governmental organizations, such as the United States Geological Survey. An earthquake prediction is a short-term (hours to days) statement that an earthquake will happen in a given region. Such predictions are made by misguided (but usually sincere) people who believe that they have found a way to make valid short-term predictions. More on earthquake prediction below.
The obvious question is, if earthquake forecasts are in some sense ``approved'' and are based on science, how do they work? The answer is that it's complicated, and I'm not an expert in this, so I will try to simplify things and give you a list of suggested places you could turn to for more information.
In order to understand the discussion below, you need to understand two other concepts: slip rate and the characteristic earthquake model. The slip rate is the rate at which the two blocks of rock on either side of the fault would move if no friction held them together. In some places of California, for example along the San Andreas fault near Hollister, the blocks of rock do move relative to one another at the slip rate -- a phenomenon called aseismic creep. But in most places, the rocks are stuck, but ``want'' to move at the slip rate.
The characteristic earthquake model is pretty simple really. Basically, it says that a given fault, with a given set of geologic conditions (strength of the rock, length of the fault, rate of slip along the fault, etc.) ``wants'' to break in a particular characteristic fashion. It ``wants'' to break repeatedly over time when a similar, characteristic set of conditions is reached; this generates a similar, characteristic-sized earthquake. This concept is fundamental to earthquake forecasts, because it says that, while the timing of earthquakes is not necessarily predictable, the past behavior of the fault can be a useful guide to its future behavior.
You need several ingredients for an earthquake forecast. These include:
Question 1 is pretty obvious. If you don't have faults, you can't have tectonic earthquakes, and where there are faults, there is the potential for earthquakes on them.
Question 2 is not so obvious. Even very large faults such as the San Andreas are not one long continuous crack in the ground. Instead, a fault is usually made up of a series of smaller segments which either meet end-to-end or form a zone over which movement takes place. On the San Andreas, the longest segment is only 18 km long, and an estimate of the average segment length is something like 3-5 km. How a fault is segmented is important because the longer a segment is, the larger an earthquake it is capable of generating, on average. Segmentation is usually decided by detailed geologic mapping.
Questions 3 and 4 go together. It's important to know how often a given segment ruptures in earthquakes, and how long it has been since the last one, because those two things together can give you some idea of how long it will be until the next one. Keep in mind that ``some idea'' here is often measured in decades, with error bars of decades or even centuries! This is definitely not a completely exact part of science; but don't get me wrong -- it often works well. Clearly, a fault which has earthquakes frequently, and which has not had one in a while, is likely to be more of a risk than one which does not have large earthquakes very often and just had one. But keep in mind that none of this is exact; we are discussing probabilities.
Questions 5, 6 and 7 also go together and link also to Question 4. If you know about how much displacement, or relative movement between the two rock bodies on either side of the fault, happens in the characteristic earthquake on a given fault, and you know about how fast the two sides of the fault are moving relative to one another, both over geologic time scales and currently, you can get an estimate of how much time usually separates characteristic quakes. And if you can compare this to how long it has been since the last one, you can develop an idea of about how close the rock is to snapping. For example, if you have a fault slipping 30 mm/year, and during the characteristic quake on a given segment of that fault about 3 meters of relative motion happens, you can divide 3 meters by 30 mm/year and come up with a time of 100 years between repetitions of a characteristic earthquake. This time is called, not too surprisingly, the repeat time.
You can also apply this knowledge in a somewhat different way to estimate how big a particular earthquake might get on a given fault segment. If you know the last earthquake on a given segment was, say, 300 years ago, and you know that the slip rate along that fault is, say 30 mm/year, you can multiply those two numbers together to decide how much stored-up motion there is along that fault, in this case 9000 mm, or 9 meters. You can then make an estimate of how big an earthquake would occur if all 9 meters of stored-up slip were to be released in one earthquake. This stored-up slip is called a slip deficit.
OK, so how are some of these questions answered? Well, as I said, Questions 1 and 2 are usually answered through detailed geologic mapping, to find where the surface manifestations of various faults and fault segments are. Question 6 is also usually answered through mapping and studying geomorphology.
Questions 3, 4, and 5 are now usually answered by digging a network of trenches in three dimensions across a section of a fault. My friend Dr. Tom Rockwell at San Diego State has dug trenches of this sort across the Rose Canyon fault (among many others) to look at its behavior, for example, and he very kindly gave me the following three figures as examples of what these trenches are like (Thanks, Tom!). Other people also do this sort of work; the other true expert of the whole field (besides Tom Rockwell) is Dr. Kerry Sieh at Caltech. Kerry did the pioneering work of this kind at a place called Pallett Creek along the San Andreas Fault.
Overhead view of a trench across the Rose Canyon fault near the Pacific Beach In-N-Out Burger restaurant. The fault runs left-to-right through the center of the picture. The trench is roughly 2-4 meters deep in places, and about 30 meters long by 15 meters wide. It took five people working 6 days a week, 10 hours a day over 7 weeks to do the trench by hand. Image by Tom Rockwell, San Diego State University.
View of the wall of the trench in the previous figure. The active strand of the Rose Canyon Fault is shown by the small red squares (the heads of marking pins). The dark grey rock layer on the left side of the fault represents the youngest rock material. The layer below the grey material is the same as the layer to the right of the grey material, but has been dropped as much as 50 cm relative to the right side. Image by Tom Rockwell, San Diego State University.
Diagram of the layers in one wall of the trench in the previous figures. Red lines are fault strands, while layers A, B, C1, C2, C3, and D are different rock layers. Notice the layers are broken by the various strands of the fault. The other symbols mark spots at which 14C dating samples have been taken. Image by Tom Rockwell, San Diego State University.
So now you've seen what these things look like, here's what you do: dig a trench across the fault and work to identify different rock layers. After that, you find where the breaks in the layers are and marks those as faults. You make measurements of the amount of relative movement between the same rock layers on different sides of the fault, which tell you how much motion there was in the earthquakes which broke the rock. If you can dig out samples of wood, bone, or other organic materials that have 14C in them, you can then date these samples, and by keeping track of which layers they were in, you can begin to develop ages for the layers, and thus ages for the earthquakes which broke those layers. With much painstaking work, you can develop a history of the fault motions at that point along the fault. By making many trenches and repeating this kind of work, you can begin to match ruptures in time, and thus map out the extent of motion in old earthquakes. This is extremely important information for figuring out the characteristic earthquakes on your fault segment.
Question 7 is answered by making extremely precise measurements of the positions of various points on the earth's surface, called benchmarks. If you go out and repeatedly measure the positions of the same set of benchmarks over time, and your measurements are accurate enough, you will observe changes in the relative positions of these marks. If you manipulate these positions and the changes in them, you can work out how the shape of the ground in your study area is changing over time. From that, you can try to make models of the faults in the region and see how they are slipping.
There are a number of techniques which people use to make these sorts of measurements. They are lumped together under the term geodesy. Among the techniques used are
OK, so all that said, what about southern California? Well, the overall earthquake forecast for southern California is that there is about an 85% chance of at least one magnitude 7 earthquake in southern California between 1994 and 2024, not including the Northridge earthquake. That's a very high probability of having a destructive earthquake. It is not, however, the same over all areas of southern California. Areas near major faults, such as the San Andreas, San Jacinto, Newport-Inglewood, etc. have a higher chance of a large earthquake than other areas. Also, please note that the statement above does not mean that you can relax, because we won't have an earthquake until 2024. There is an 85% chance of at least one between now and then -- one might not happen for ten years, but one could also happen in the next minute. Also, please remember that damage from an earthquake depends strongly on local soil and rock conditions, and on the condition of your building. And finally, you must keep in mind that this forecast was based on the best information available when it was made. Things do change in this field, and new forecasts will certainly be made -- keep yourself up to date. The figure below shows the latest forecast for southern California in a nice map.
Latest forecast for strong ground shaking in southern California. The color shows the number of times per century that a given area might encounter ground shaking strong enough to cause major damage. Note that this map assumes that all the ground is solid rock --- there will be big differences if you take into account the variations in rock type. Also note that the most recent data on the Rose Canyon fault (among others) is not included in this map. Keep in mind that things will change! Map by Southern California Earthquake Center.

There are numerous web sites devoted to earthquake forecasting. Here are a couple good ones:
Please keep the most important part of this in mind: earthquake forecasts are not earthquake predictions. Earthquake forecasts are an emerging, tested, scientifically sound way of making long-term statements about the seismic hazard in a given region. Earthquake predictions, on the other hand, are usually attempts by misguided (but no doubt sincere) people to make short-term predictions.
While San Diego is relative safe (seismically, anyway) compared to San Francisco or Los Angeles, it is still in California. And keep in mind that being relatively safe in California is still pretty risky, seismically at least. So while we are safer than much of the rest of the state, we are still at risk for large earthquakes.
Some of the faults nearby which might have earthquakes which cause damage in San Diego County are:
And I have deliberately left out the biggest single threat to San Diego itself: the Rose Canyon Fault Zone (RCFZ). The RCFZ is active and runs right through downtown, under Lindbergh Field, through Old Town, across the east side of Mission Bay and Pacific Beach, up along Interstate 5, over Ardath Road, and out into La Jolla Bay near the Scripps Institution of Oceanography. The latest information on the fault is that it can generate earthquakes as big as magnitude 7 -- more than big enough to cause severe damage to San Diego proper.
Here's what we now know about the RCFZ, thanks mostly to trenching work done by Dr. Tom Rockwell and his students at San Diego State University (see the trenching figures above):
Below is a nice map I borrowed from the Southern California Earthquake Center. It shows the faults in and near San Diego, and should emphasize further in your mind that San Diego is definitely earthquake country. You can see a nice version of this map, complete with clickable faults which (when you click one) bring up a bit of information on the fault you chose.
Map of San Diego County and surrounding area, with major known faults shown. Also shown for reference are the major freeways and elevation shading. Map by Southern California Earthquake Center.
San Diego County has had damaging earthquakes in the past, though not as many as some other areas of the state. The biggest earthquakes that we are sure were nearby were in 1862 and 1892, with another big one possible in 1800. The 23 February 1892 earthquake was probably on the Laguna Salada fault, about 125 kilometers east of San Diego, but still caused much damage in San Diego (big cracks in the walls of some buildings, etc.). San Diego also suffered some damage from the 28 June 1992 Landers earthquake, mostly in the form of broken dishes and such and mostly along the beach, where the loose ground amplified the shaking.
There have also been smaller, more recent earthquakes which caused some concern and damage. In 1986, there was a sequence of magnitude 3 and 4 earthquakes just off the coast of Coronado which stirred up a lot of interest and caused a bit of damage. And later in 1986, there was a magnitude 5 earthquake just off Oceanside which caused some damage and was widely felt.
The point of all this is that San Diego has an active earthquake history and is certainly going to have more earthquakes in the future. Obviously, the biggest single risk is the RCFZ, but there are others as well. Further research, including trenching by Tom Rockwell and others and GPS studies by my friend Hadley Johnson and others, will help place more and useful constraints on the dangers facing San Diego.
You might be interested in knowing where you can go to see faults in San Diego. It turns out that there are a couple of nice spots to go to see the Rose Canyon Fault.
One of the best places to go is Tecolote Canyon Natural Park, east of Mission Bay. The visitor's center there can direct you to the best exposure of the Rose Canyon fault in the park (it turns out to be just behind the ball fields!).
Another good spot is the Bayside Trail out on Point Loma. Go to the Cabrillo National Monument Visitor's Center on a nice clear Sunday afternoon. It will cost $5 for a daily permit for one car. The Monument is open from 9 am to 5:15 pm, but the Bayside Trail closes at 4 pm. Bring a picnic lunch -- there are some nice views of San Diego Bay from the trail. You can get a map of the Bayside Trail from the Visitor's Center, and set off on your hike. About a half-mile or so into the hike, you will go around a point and turn left into a canyon. On the far side canyon wall, you should be able to make out a clear fault trace, with offset rock layers. There's also a small cave (really nothing more than an alcove in the wall) you can poke your head into. Anyway, the trail's nice and a good place for a light hike. I think the total hike is about two miles.
Several methods have been tested in the effort to learn how to predict earthquakes. Among the more serious methods which have been examined are seismicity changes, changes in seismic wave speed, electrical changes, and groundwater changes. Note that in what follows, I am oversimplifying.
``Seismicity changes'' is basically a fancy way of saying ``changes in the patterns in space and time of the locations of earthquakes''. Sometimes large earthquakes have foreshocks near the hypocenter of the mainshock, which might signal the onset of the larger earthquake. The problem for earthquake prediction is that not all earthquakes have foreshocks, and we don't yet understand what to look at to figure out if a given small earthquake will become a foreshock. This is an active area of research.
In the 1970s in the Soviet Union, several seismologists noted changes in the speeds of seismic waves in regions where later there were earthquakes. They noted that first the speeds dropped by a small amount up to a year ahead, and then a few weeks to months prior to the earthquake, the speeds began to increase again. Unfortunately, while this topic caused a lot of excitement in seismology 20 years ago, it has not lived up to the hype.
Changes in the Earth's electrical conductivity and electric and magnetic fields have sometimes been noted in areas near the future epicenter of a large earthquake. These changes could be brought on by changes in deep fluids along a fault plane or by stresses in the rocks along a fault. For example, just prior to the 1989 Loma Prieta earthquake, a group of scientists from Stanford University detected a massive increase in the noise level on one of their electric field recorders located in the Santa Cruz Mountains only a few kilometers from the San Andreas Fault. This got lots of people excited, and several experiments are in progress, but for now, the predictive value of these changes has not yet been demonstrated.
Changes in groundwater are also sometimes noted before earthquakes. These changes can include flow rates (sometimes wells dry up or dry wells become flowing again), taste or smell changes, and changes in chemistry, particularly in the concentration of the radioactive gas radon. All these have been noted in some earthquakes, but again, they are not universal features.
Are you beginning to see a pattern here? The real problem with earthquake prediction is that nobody has yet found a single factor or set of factors that always behaves in the same fashion before every earthquake of a given size and never behaves that way except before earthquakes. Until such a set of factors is found, we won't be able to make successful short-term earthquake predictions. In fact, some seismologists are now coming to believe (after 20-30 years and billions of dollars spent worldwide) that earthquakes may be fundamentally unpredictable -- that earthquake prediction is, in fact, completely impossible.
These facts have not stopped many people from trying, however. These folks are largely sincere in their belief that they can predict earthquakes, and many of them are bitter because "the scientific establishment" is ignoring them. I won't try to pass judgment on these folks (I've learned my lessons on this one, believe me), but I will reiterate that these methods have never been independently proven to work, at least not that I've ever seen.
OK, so by now you are probably wondering if there has ever been a successful earthquake prediction anywhere in the world. To the best of my knowledge, the answer is no. Nobody that I am aware of has been able to consistently make accurate short-term predictions with a technique that stands up to independent review.
Just out of fairness, I should say that the American seismological community has had no better luck with earthquake prediction than anyone else. Some of you may have heard of the Parkfield prediction. Parkfield is a tiny town (population 33, I think) in central California which seems to have magnitude 6 earthquakes at regular intervals, about every 22 years. Since the last one was in 1966, a prediction was made in 1984 that there was a 90% chance of another magnitude 6 earthquake in Parkfield by 1993.
It hasn't happened. And many millions of dollars worth of geophysical equipment -- everything from seismometers to tiltmeters to strainmeters to radon detectors to laser distance measuring systems to electric and magnetic field records -- sits in the hills there waiting for the next quake. When it comes, we should get loads of potentially very valuable data on what happens near the epicenter of a large earthquake just before that earthquake happens. But it must be said that the prediction itself has failed -- the earthquake did not come in the specified window of time.
You may detect a note of frustration on my part with earthquake prediction. While I believe that it would be useful to be able to make short-term earthquake predictions, I personally doubt we will ever get there. My frustration comes from having dealt with many amateur predictors who simply don't understand that they need to prove they can predict earthquakes, rather than just say they can. OK, you ask, but how would you go about proving that you can predict earthquakes?
That's a good question. Here are the five crucial features that any good earthquake prediction must have:
Many cultures that experienced earthquakes have developed myths to explain their origins. For example, one Greek explanation was that gases from the atmosphere became trapped below ground and rolled around looking for a way out. The rolling generated earthquakes, and when the gases found a way out, there were volcanoes. This myth has carried on and developed into the modern myth of earthquake weather (see below).
The Japanese explanation was that a huge catfish called a namazu lived beneath the ground. When the namazu shook and thrashed about, earthquakes happened. The gods placed another god, called a daimyojin, in charge of making sure the namazu didn't trash about by striking it on the head with a large wooden mallet. If the daimyojin was vigilant, no earthquakes, but if he was not, watch out!
Another interesting myth comes from the Maori of New Zealand. One story has it that the god Ruaumoko was responsible for earthquakes. Apparently, his mother (the Earth Mother) was feeding him and rolled over, pressing him into the ground. He didn't exactly appreciate this, so he has been complaining ever since - his growls cause earthquakes and his cries cause eruptions.
Sorry to disappoint those on the East Coast who would love to have us disappear, but there is no chance that California will fall off and sink into the ocean. Since the the major faults in California are mostly strike-slip, and have little or no vertical motion, there is no way for large blocks of California to fall off. Note that I am not saying that some parts of the state don't fall into the ocean every day in landslides. What I am talking about is the ridiculous belief that huge chunks of California are going to tear away and go sinking into the brine.
Of course, this is not to say that California won't undergo some changes as a result of plate tectonics. If nothing else, the sliver of California which is southwest of the San Andreas Fault is on a different plate from the rest of California. This sliver contains Los Angeles and San Diego, and is moving northwest relative to the rest of the state at a rate of a few centimeters each year - so that in about 20 million years, Los Angeles will be a suburb of San Francisco.
There has never been any recorded case of an earthquake causing cracks to open up and swallow cities. Certainly, earthquakes can cause cracks to form in the Earth, such as happened during the Loma Prieta earthquake in 1989. However, these cracks are generally quite small and only rarely do they exceed a meter or two in width. And certainly these cracks don't again close up and swallow somebody whole.
Below is a nice picture of a large crack which opened in the ground after the Loma Prieta earthquake. It is not actual ground rupture, but is instead ground failure. This is a typical crack for an earthquake --- and as you can see, it hasn't swallowed the house in the background.
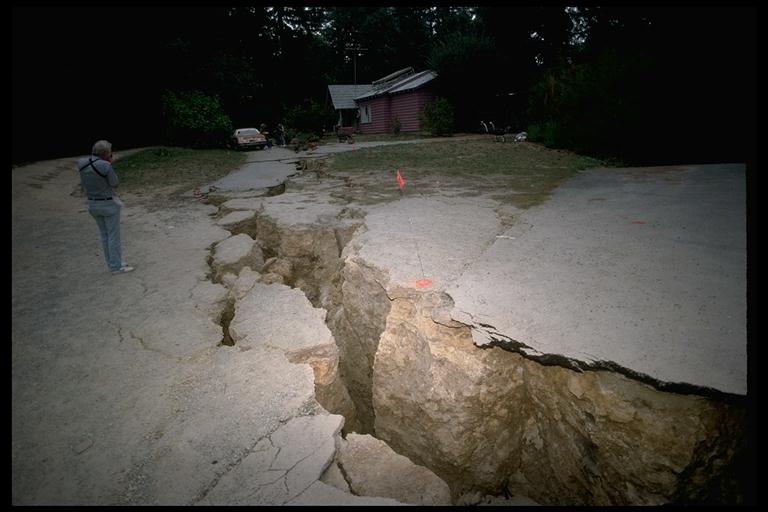
Originally image 056sr.jpeg, by J.K. Nakata, U.S. Geological Survey
In fact, there is only one case that I am aware of in which anyone actually died as a direct result of becoming trapped in an earthquake-caused crack. In the 1906 earthquake, near the town of Olema on Pt. Reyes, there was such a casualty -- to a cow, which fell into a crack and was killed.
On hot days with no wind, some people will tell you that an earthquake is coming -- that it is ``earthquake weather'', and you'd better be ready. That is simply not true.
The myth of ``earthquake weather'' dates back to the 4th century B.C. Greek philosopher Aristotle. Aristotle believed that earthquakes were caused by winds rumbling around in huge underground caverns, restlessly searching for a way out to the surface. These winds were trapped below ground, so there would be no wind above ground, and it would be stiflingly hot. Clearly, Aristotle was wrong.
However, his folly took hold and even today, there are people who believe in ``earthquake weather.'' To date, however, there have been numerous studies done to try to find a link between weather and earthquakes. No such link has been found. If anyone out there who reads this knows of a solid counter-example in the literature, please let me know!
One of my friends, Dr. Robert Uhrhammer at the UC Berkeley Seismographic Station, has this to say about ``earthquake weather'': `` `Earthquake weather' is whatever the weather was during the last big earthquake.'' In other words, people sometimes see patterns when there are no patterns to be seen. ``Earthquake weather'' simply does not exist.
One of the most interesting bits about seismology is that it is not very hard to ask a question to which the answer is "nobody knows". (My biologist friends tell me that the answer in their field is "nobody knows, and if you find out, you'll win the Nobel Prize".) I'll just list these questions below, as thinking points.
Greg Anderson