This was the longest and most challenging of the problems, and I'm happy to report that the majority of people in the class did quite well on it -- after all, it was not a particularly easy problem.
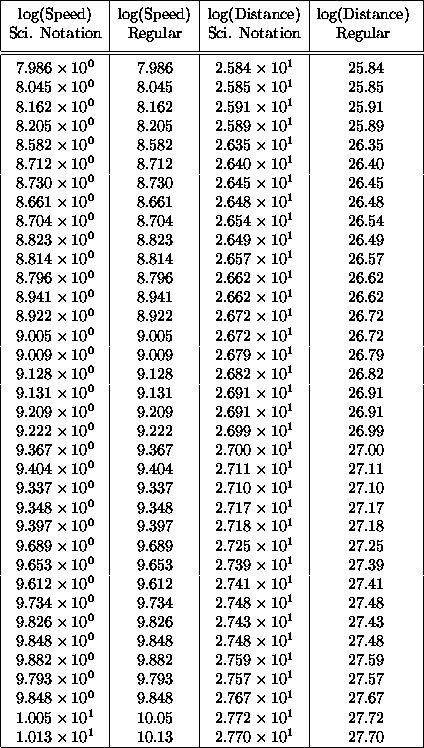
Table 1 of this answer sheet (all the tables are at the end of this sheet) is just Table 1 from Homework 2, with two added columns. Table 1 from Homework 2 had the numbers written in scientific notation, so you needed to translate back to ``regular'' notation, which I have shown in the extra two columns.
Now, the next step is where most people that had problems had their problems. In Homework 2, I stated that the table of numbers contained the logarithms of the actual speeds and distances, not the actual speeds and distances themselves. So before you can use the numbers to do anything for the rest of the problem, you first have to take the antilogarithms of the numbers you were given in the table of numbers. Here's how you take the antilogarithm:
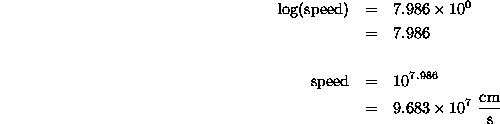
and so on through the rest of the numbers in the table in the homework. If you don't take the antilogarithms, the rest of your work might all be right, but your answer will still be off, because you will be working with the logs of the actual values which you should be working with.
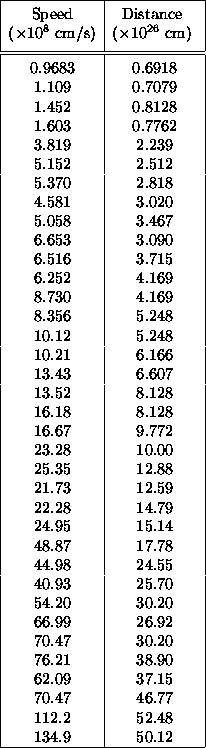
Table 2 gives the actual speeds (in multiples of
![]() cm/s) and distances (in multiples of
cm/s) and distances (in multiples of ![]() cm) for the galaxies.
These are the antilogarithms of the numbers in Table 1, and are
the numbers which you should use for the next step.
cm) for the galaxies.
These are the antilogarithms of the numbers in Table 1, and are
the numbers which you should use for the next step.
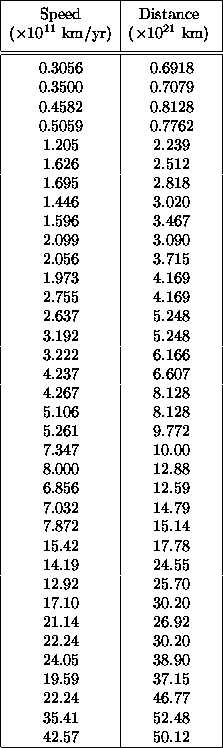
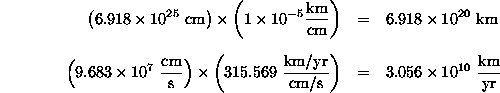
Next, you need to convert the numbers in Table 2 from cm to km (for the distance) and cm/s to km/yr (for the speed). First, let's work out how to convert from cm are to km:
![]()
So there are ![]() (or 0.00001) kilometers in one centimeter.
(or 0.00001) kilometers in one centimeter.
Next, how to convert from cm/s to km/yr:
![]()
So, if you are travelling at a speed of 1 cm/s, you will travel 315.569 km in one year.
Now, all you have to do to convert the values in Table 2 to the desired units is multiply by the numbers I just derived above. For example:
Repeating this for all the entries in Table 2, we can create Table 3. From Table 3, one can make a graph to find the age of the universe.
Figure 1 shows the graph I made from Table 3 using my computer.
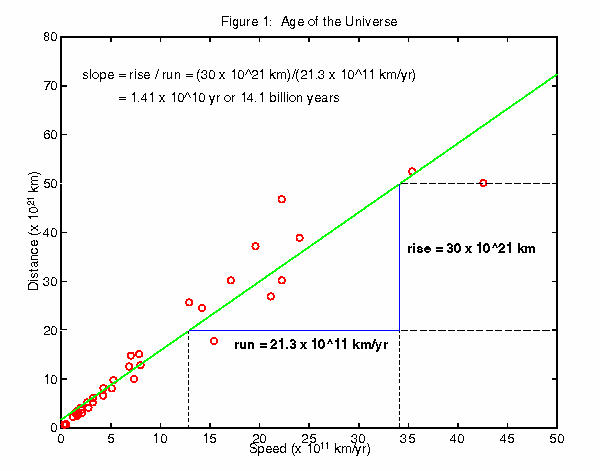
The X-axis is speed, in multiples of ![]() km/yr; the Y-axis is distance,
in multiples of
km/yr; the Y-axis is distance,
in multiples of ![]() km. The small red circles are the actual data
points.
km. The small red circles are the actual data
points.
I used a fancy math technique called ``least-squares fitting'' to figure out the slope and intercept of the green line, which is the computer's estimate of the line which best fits the overall trend of the data. This is the line I asked you to draw - not a ``connect-the-dots'' plot, but a scatter plot with a single straight line which represents the overall trend of the numbers in Table 3.
I have also indicated the slope of my line and how to compute it based on the graph. In general, the slope of a line is given by
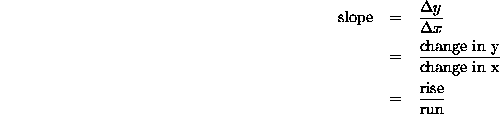
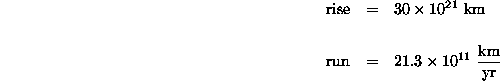
I have indicated the rise in Figure 1 by the vertical blue line which connects the horizontal long-dashed lines, and the run by the horizontal blue line which connects the vertical short-dashed lines. In this case, the values are:
and the slope is
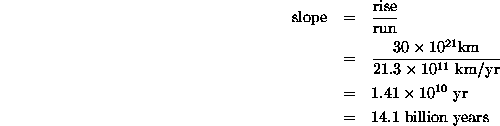
So my estimate of the age of the universe is 14.1 billion years.
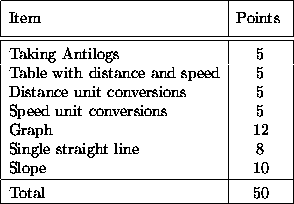
In case you are interested, Table 4 shows how I broke down the points in grading.
All the tables are shown below here.