First off, let's make sure we get terms right. An earthquake forecast is not an earthquake prediction. An earthquake forecast is a long-term (years to decades) statement of the probabilities for a large earthquake on a given fault or in a given region. Such forecasts are now made by responsible scientific and governmental organizations, such as the United States Geological Survey. An earthquake prediction is a short-term (hours to days) statement that an earthquake will happen in a given region. Such predictions are made by fools or charlatans or, I must admit, by a few people who sincerely believe that they have found a way to make valid short-term predictions. More on this in Section 4.
The obvious question is, if earthquake forecasts are in some sense ``approved'' and are based on science, how do they work? The answer is that it's complicated, and I'm not an expert in this, so I will try to simplify things and again give you a list of suggested places you could turn to for more information.
In order to understand the discussion below, you need to understand two other concepts: slip rate and the characteristic earthquake model. The slip rate is the rate at which the two blocks of rock on either side of the fault would move if no friction held them together. In some places of California, for example along the San Andreas fault near Hollister, the blocks of rock do move relative to one another at the slip rate -- a phenomenon called aseismic creep. But in most places, the rocks are stuck, but ``want'' to move at the slip rate.
The characteristic earthquake model is pretty simple really. Basically, it says that a given fault, with a given set of geologic conditions (strength of the rock, length of the fault, rate of slip along the fault, etc.) ``wants'' to break in a particular characteristic fashion. It ``wants'' to break repeatedly over time when a similar, characteristic set of conditions is reached; this generates a similar, characteristic-sized earthquake. This concept is fundamental to earthquake forecasts, because it says that, while the timing of earthquakes is not necessarily predictable, the past behavior of the fault can be a useful guide to its future behavior.
You need several ingredients for an earthquake forecast. These include:
Question 1 is pretty obvious. If you don't have faults, you can't have tectonic earthquakes, and where there are faults, there is the potential for earthquakes on them.
Question 2 is not so obvious. Even very large faults such as the San Andreas are not one long continuous crack in the ground. Instead, a fault is usually made up of a series of smaller segments which either meet end-to-end or form a zone over which movement takes place. On the San Andreas, the longest segment is only 18 km long, and an estimate of the average segment length is something like 3-5 km. How a fault is segmented is important because the longer a segment is, the larger an earthquake it is capable of generating, on average. Segmentation is usually decided by detailed geologic mapping.
Questions 3 and 4 go together. It's important to know how often a given segment ruptures in earthquakes, and how long it has been since the last one, because those two things together can give you some idea of how long it will be until the next one. Keep in mind that ``some idea'' here is often measured in decades, with error bars of decades or even centuries! This is definitely not a completely exact part of science; but don't get me wrong -- it often works well. Clearly, a fault which has earthquakes frequently, and which has not had one in a while, is likely to be more of a risk than one which does not have large earthquakes very often and just had one. But keep in mind that none of this is exact; we are discussing probabilities.
Questions 5, 6 and 7 also go together and link also to Question 4. If you know about how much displacement, or relative movement between the two rock bodies on either side of the fault, happens in the characteristic earthquake on a given fault, and you know about how fast the two sides of the fault are moving relative to one another, both over geologic time scales and currently, you can get an estimate of how much time usually separates characteristic quakes. And if you can compare this to how long it has been since the last one, you can develop an idea of about how close the rock is to snapping. For example, if you have a fault slipping 30 mm/year, and during the characteristic quake on a given segment of that fault about 3 meters of relative motion happens, you can divide 3 meters by 30 mm/year and come up with a time of 100 years between repetitions of a characteristic earthquake. This time is called, not too surprisingly, the repeat time.
You can also apply this knowledge in a somewhat different way to estimate how big a particular earthquake might get on a given fault segment. If you know the last earthquake on a given segment was, say, 300 years ago, and you know that the slip rate along that fault is, say 30 mm/year, you can multiply those two numbers together to decide how much stored-up motion there is along that fault, in this case 9000 mm, or 9 meters. You can then make an estimate of how big an earthquake would occur if all 9 meters of stored-up slip were to be released in one earthquake. This stored-up slip is called a slip deficit.
OK, so how are some of these questions answered? Well, as I said, Questions 1 and 2 are usually answered through detailed geologic mapping, to find where the surface manifestations of various faults and fault segments are. Question 6 is also usually answered through mapping and studying geomorphology.
Questions 3, 4, and 5 are now usually answered by digging a network of trenches in three dimensions across a section of a fault. My friend Dr. Tom Rockwell at San Diego State has dug trenches of this sort across the Rose Canyon fault (among many others) to look at its behavior, for example, and he very kindly gave me Figures 9, 10, and 11 as examples of what these trenches are like (Thanks, Tom!). Other people also do this sort of work; the other true expert of the whole field (besides Tom Rockwell), still extremely active in it, is Dr. Kerry Sieh at Caltech. He did the pioneering work of this kind at a place called Pallett Creek along the San Andreas Fault (and has some great stories to tell, believe me!).
Figure 9. Overhead view of a trench across the Rose Canyon fault near the Pacific Beach In-N-Out Burger restaurant. The fault runs left-to-right through the center of the picture. The trench is roughly 2-4 meters deep in places, and about 30 meters long by 15 meters wide. It took five people working 6 days a week, 10 hours a day over 7 weeks to do the trench by hand. Image by Tom Rockwell, San Diego State University.
Figure 10. View of the wall of the trench in Figure 9. The active strand of the Rose Canyon Fault is shown by the small red squares (the heads of marking pins). The dark grey rock layer on the left side of the fault represents the youngest rock material. The layer below the grey material is the same as the layer to the right of the grey material, but has been dropped as much as 50 cm relative to the right side. Image by Tom Rockwell, San Diego State University.
Figure 11. Diagram of the layers in one wall of the trench. Red lines are fault strands, while layers A, B, C1, C2, C3, and D are different rock layers. Notice the layers are broken by the various strands of the fault. The other symbols mark spots at which 14C dating samples have been taken. Image by Tom Rockwell, San Diego State University.
What you do is dig a trench across the fault and work to identify different rock layers. After that, you find where the breaks in the layers are and marks those as faults. You make measurements of the amount of relative movement between the same rock layers on different sides of the fault, which tell you how much motion there was in the earthquakes which broke the rock. If you can dig out samples of wood, bone, or other organic materials that have 14C in them, you can then date these samples, and by keeping track of which layers they were in, you can begin to develop ages for the layers, and thus ages for the earthquakes which broke those layers. With much painstaking work, you can develop a history of the fault motions at that point along the fault. By making many trenches and repeating this kind of work, you can begin to match ruptures in time, and thus map out the extent of motion in old earthquakes. This is extremely important information for figuring out the characteristic earthquakes on your fault segment.
Question 7 is answered by making extremely precise measurements of the positions of various points on the earth's surface, called benchmarks. If you go out and repeatedly measure the positions of the same set of benchmarks over time, and your measurements are accurate enough, you will observe changes in the relative positions of these marks. If you manipulate these positions and the changes in them, you can work out how the shape of the ground in your study area is changing over time. From that, you can try to make models of the faults in the region and see how they are slipping.
There are a number of techniques which people use to make these sorts of measurements. They are lumped together under the term geodesy. Among the techniques used are
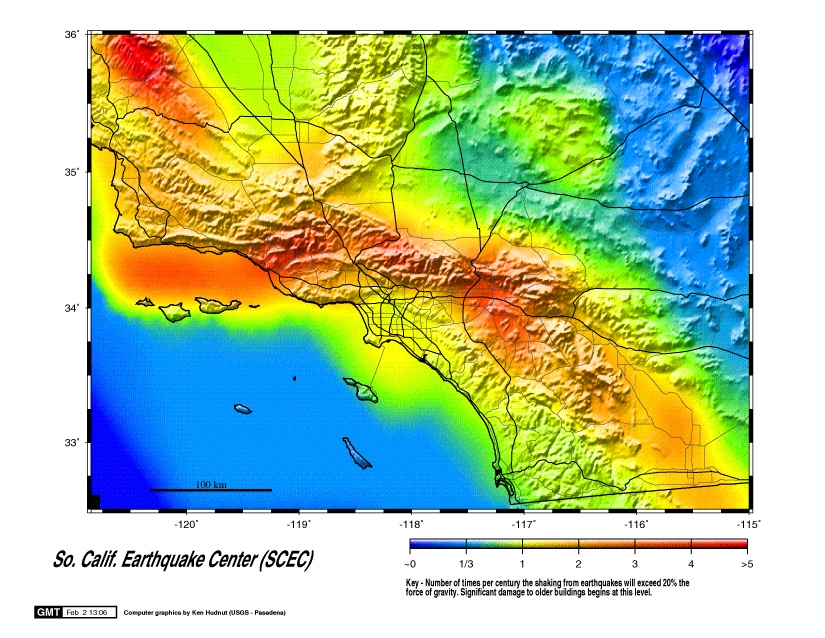
OK, so all that said, what about southern California? Well, the overall earthquake forecast for southern California is that there is about an 85% chance of at least one magnitude 7 earthquake in southern California between 1994 and 2024, not including the Northridge earthquake. That's a very high probability of having a destructive earthquake. It is not, however, the same over all areas of southern California. Areas near major faults, such as the San Andreas, San Jacinto, Newport-Inglewood, etc. have a higher chance of a large earthquake than other areas. Also, please note that the statement above does not mean that you can relax, because we won't have an earthquake until 2024. There is an 85% chance of at least one between now and then -- one might not happen for ten years, but one could also happen in the next minute. Also, please remember that damage from an earthquake depends strongly on local soil and rock conditions, and on the condition of your building. And finally, you must keep in mind that this forecast was based on the best information available when it was made. Things do change in this field, and new forecasts will certainly be made -- keep yourself up to date. Figure 12 shows the latest forecast for southern California in a nice map.
Figure 12. Latest forcast for strong ground shaking in southern California. The color shows the number of times per century that a given area might encounter ground shaking strong enough to cause major damage. Note that this map assumes that all the ground is solid rock --- there will be big differences if you take into account the variations in rock type. Also note that the most recent data on the Rose Canyon fault (among others) is not included in this map. Keep in mind that things will change! Map by Southern California Earthquake Center.
There are numerous web sites devoted to earthquake forecasting. Here are a couple good ones:
Please keep the most important part of this in mind: earthquake forecasts are not earthquake predictions. Earthquake forecasts are an emerging, tested, scientifically sound way of making long-term statements about the seismic hazard in a given region. Earthquake predictions, on the other hand, are usually attempts by fools or charlatans to make short-term predictions. Only one prediction has ever been proven to have been valid, and it was over 20 years ago. Section 4 discusses earthquake prediction in more detail.
Greg Anderson